

Swing Trading
Hold trades for days to weeks using clear setups, entry and exit rules, and a trade journal.
1. What swing trading is
Swing trading holds positions for days to a few weeks to capture a price swing. It sits between intraday trading (same day) and investing (months or years). It suits people with a job who can check the market once or twice a day, but it needs patience, a clear plan and a journal.
2. The time you give a trade
A swing trade is not an investment and not a day trade. You enter because of a setup, and you plan the maximum time you will hold it. If the trade does not move within that time, the setup has failed, and you exit even if the loss is small. Holding a losing trade for months is a different strategy, and it usually goes wrong.
- Typical holding period: 3 to 20 sessions, decided before entry.
- Overnight holding: gaps can open far beyond your stop, so position size must allow for this.
- Market hours: you can plan on the daily chart after the close, and place orders for the next session.
3. Setups: the reasons to enter
A setup is a repeatable situation with a clear rule. Common swing setups are a breakout above resistance on volume, a pullback to a rising moving average in an uptrend, a bullish reversal candle at support, and a range breakout after a squeeze. Write each setup as a rule, for example: close above the 20-day high with volume 1.5 times average, in an uptrend (price above the 50-day average).
4. Entry, stop and target: the complete plan
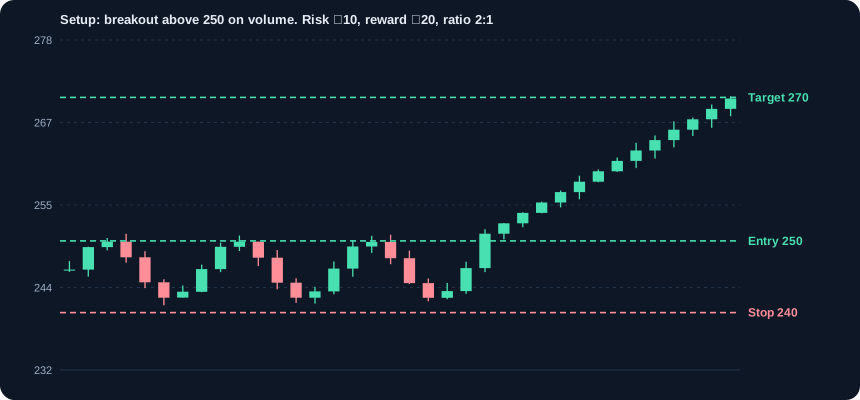
- Entry: the price or condition that triggers the trade, for example a close above ₹250.
- Stop-loss: where the idea is proven wrong, for example below the last swing low at ₹240. Place it before you enter.
- Target: the level where you take profit, for example previous resistance at ₹270, or a multiple of risk.
- Reward-to-risk: (target − entry) ÷ (entry − stop). Example: (270 − 250) ÷ (250 − 240) = 2. Many traders require at least 2.
5. Position sizing: the most important number
Decide the maximum loss you accept on one trade, usually 0.5% to 2% of capital. The position size follows from the stop distance, not from how confident you feel.
Example: capital ₹1,00,000, risk 1% = ₹1,000. Entry ₹250, stop ₹240. Risk per share ₹10. Shares = 1,000 ÷ 10 = 100. Position value = ₹25,000 (25% of capital). The stop limits the loss to about ₹1,000 before costs and any gap.
6. Trade management after entry
Once in a trade, the plan decides your actions, not emotion. Move the stop up only as the trade proves itself, for example to break-even after the price moves 1 times the risk. Take partial profits at the first target if you want, and let the rest run with a trailing stop. Never widen a stop to avoid a loss.
- Move to break-even after a move equal to your initial risk (example: +₹10 on a ₹10 risk).
- Trail the stop below higher swing lows, or below a moving average.
- Exit at the time limit if the trade has gone nowhere.
7. Gaps: the risk that breaks stops
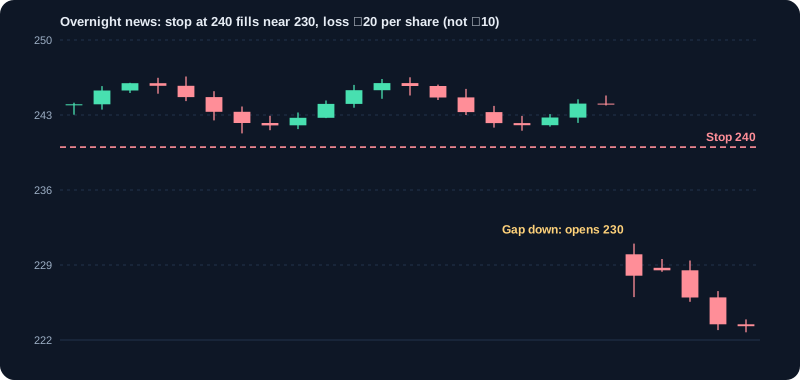
A gap is when the price opens far above or below the previous close, usually after news. A stop is an order to exit at a price, but in a gap the first available price may be much worse. Example: stop at ₹240, bad news, the stock opens at ₹230. The loss is ₹20 per share, double the planned ₹10. Reduce size before holding through events such as results, budgets and policy announcements.
8. Sector and market context
A good stock in a weak sector or a falling market often fails. Check the index trend and the sector trend before entering. Swing traders who follow strong sectors and the broad market tend to have higher success rates than those who trade single stocks in isolation.
9. Keeping a swing trading journal
Record the setup, reason, date, entry, stop, target, size, exit, result in rupees and in R (multiples of risk), and any mistake. Review monthly. Common findings: setups that do not work for you, exits that come too early, and stops that move against the plan.
10. A worked example from start to finish
A stock closes above its 20-day high at ₹250 with volume 1.5 times average, in an uptrend. You buy 100 shares at ₹250 with a stop at ₹240 and a target at ₹270. Three days later the price reaches ₹262; you move the stop to ₹250 (break-even). Two days later price falls back to ₹250 and exits. Loss: 0 before costs. Next setup: another breakout. The example shows that the stop protects the account even when the trade does not go your way.
11. Common swing trading mistakes
- Entering without a stop because the setup looks strong.
- Moving the stop further away when the price approaches it.
- Holding through earnings without deciding to do so.
- Adding to a losing position to average down.
- Trading too many setups at once, which leaves no capital for the best one.
13. Swing strategies: buy and sell rules
Each strategy below has three parts: when the market condition fits, how to buy, and how to sell (stop-loss and profit target). Use one strategy at a time and write the rules before you trade. Results are shown as examples, not promises.
Strategy 1: Breakout buy
Buy when price closes above a clear resistance level on above-average volume. Best in an uptrend or after a base of consolidation.
- Buy: close above resistance (for example ₹250) with volume at least 1.5 times the 20-day average.
- Stop-loss: just below the breakout candle's low or the last swing low (for example ₹240).
- Target: the height of the base added to the breakout, or the next resistance (for example ₹270). Risk-reward should be at least 1:2.
- Sell early if: price closes back below the breakout level within 2 days. A failed breakout is an exit signal.
Example: stock breaks ₹250 on 2 times average volume. Buy 100 shares at ₹250, stop ₹240 (risk ₹1,000). Target ₹270 (reward ₹2,000). Price closes at ₹266 after three days; move stop to ₹250 (break-even) and hold for the target.
Why it works
Price that has been stuck under a level is building energy. A close above it, on volume, shows buyers have taken control of the level.
Checklist before you buy
- Resistance is clear and was tested at least twice
- Volume on the breakout is at least 1.5 times average
- The broader market and sector are not falling
- Stop and target are written before the order
Position size example
Capital ₹1,00,000, risk 1%. Entry ₹250, stop ₹240 (₹10 per share). Shares = 1,000 ÷ 10 = 100. Position value ₹25,000.
Strategy 2: Pullback to a rising moving average
Buy a dip in a strong uptrend, when price returns to a rising moving average and shows buying interest. This gives a better price than buying the breakout.
- Trend check: price above a rising 50-day average; 20-day average above 50-day.
- Buy: price touches or nears the 20-day EMA and forms a bullish candle (hammer or engulfing) with RSI turning up from around 40 to 50.
- Stop-loss: below the 50-day average or the pullback low.
- Sell: at the previous swing high, or trail the stop below each new higher low.
Example: in an uptrend, price falls to ₹248 (20-day EMA) and forms a bullish engulfing candle. Buy at ₹249, stop ₹243 (below the 50-day average), target the previous high ₹262 (risk ₹6, reward ₹13).
Why it works
In a healthy uptrend, price often returns to a rising average before continuing. Buying there gives a better price and a closer stop than chasing the breakout.
Checklist before you buy
- Price is above a rising 50-day average
- The 20-day average is above the 50-day average
- The pullback is orderly, on lower volume
- A bullish candle or RSI turn confirms the bounce
Position size example
Entry ₹249, stop ₹243 (₹6 risk). With ₹1,000 risk, shares = 1,000 ÷ 6 ≈ 166. Target ₹262 (₹13 reward) gives about 2.2 to 1.
Strategy 3: Support bounce with confirmation
Buy at a well-tested support level after a fall, only after a clear reversal signal. Works in range-bound stocks as well as at the bottom of a trend.
- Level: support tested at least twice (for example ₹240) with volume falling on each test.
- Buy: bullish reversal candle at support, followed by a close above that candle's high.
- Stop-loss: just below support (for example ₹237).
- Sell: at the middle of the range or at resistance (for example ₹255). Exit if support breaks on volume.
Why it works
A level that has held several times shows that buyers defend it. A reversal candle there tells you the defence is working right now.
Checklist before you buy
- Support has held at least twice
- Volume falls on each test of support
- The reversal candle closes above its own high
- Stop sits below support, not inside the range
Position size example
Entry ₹241, stop ₹237 (₹4 risk). With ₹1,000 risk, shares = 250. Target ₹255 (₹14 reward) is about 3.5 to 1.
Strategy 4: Trend-following exit (sell rules)
Many swing traders hold until the trend breaks rather than fixing a target. This captures large moves and needs a clear exit rule.
- Trailing stop: move the stop up to below each higher swing low.
- Moving-average exit: sell when the price closes below the 20-day EMA after being above it.
- Time exit: if the trade has not moved toward the target within the planned period (for example 15 sessions), sell and review.
- Never move a stop down. Only tighten or keep it.
Why it works
Fixed targets can cut winners short. A trailing stop lets a trend run while locking in a rising floor under the price.
Checklist before you buy
- The trend is clear (higher highs and higher lows)
- Each new stop sits below the latest higher low
- The stop never moves down
- A time limit is set in case the trend stops
Position size example
Entry ₹110, initial stop ₹104 (₹6 risk). Each higher low lifts the stop, so profit is protected as the trend continues.
Strategy 5: Sell side (short) swing trades
Short selling in swing trading means selling a stock you do not own, expecting it to fall. In India, short selling is limited to permitted stocks and products, and brokers apply margin rules. Only use it if you understand the rules and the unlimited-loss risk.
- Setup: breakdown below support on volume, or a bearish reversal at resistance in a downtrend.
- Stop-loss: just above the broken support, or above the recent swing high.
- Target: the next support level, with reward at least twice the risk.
- Check the stock is eligible for short selling and understand margin and settlement rules before trading.
Why it works
A break below support on volume means sellers have overcome a level that buyers defended before. Short selling profits from that failure of support.
Checklist before you buy
- Short selling is permitted for this stock
- Margin and settlement rules are understood
- Breakdown is on volume, not a thin day
- Stop sits just above the broken support
Position size example
Entry ₹240, stop ₹246 (₹6 risk). The loss is unlimited if price rises, so use a hard stop and keep size small.
Choosing a swing strategy
- Trending market with a clear uptrend: pullback to a rising average (Strategy 2) or breakout (Strategy 1).
- Range-bound market: support bounce (Strategy 3), selling near resistance.
- Strong trend already running: trend-following exit (Strategy 4) to keep the winner.
- Falling market with a breakdown: short setup (Strategy 5), only if permitted and understood.
Common swing strategy mistakes
- Buying a breakout that has already run 5 percent past the level, which leaves little room to the stop.
- Taking a pullback entry without a stop below the average.
- Moving targets further up when price reaches them instead of taking profit or trailing the stop.
- Using all five strategies at once. Pick one, test it, and keep a journal of results.
Charts and visuals
Worked examples
A complete swing trade
Stock at ₹250 breaks resistance. Entry ₹250, stop ₹240, target ₹270. Risk = ₹10 per share, reward = ₹20, so the ratio is 2:1. With 100 shares: if the target hits, profit ≈ ₹2,000 (2% of ₹1 lakh capital). If the stop hits, loss ≈ ₹1,000 (1%).
Expectancy over many trades
Win rate 40%, average win 2R, average loss 1R (R = the planned risk). Expectancy = 0.4 × 2 − 0.6 × 1 = +0.2R per trade. A system can be profitable with a win rate below 50% if winners are larger than losers.
Real-life scenarios
Gap down past your stop
You hold overnight with a stop at ₹240. Bad news sends the stock to open at ₹230. Your stop fills near ₹230, so the loss is ₹20 per share (2%), not the planned ₹10 (1%). Position sizing should assume some gap risk.
Sideways market for two weeks
The stock moves in a tight range for ten sessions and your target is not reached. Time has a cost. Decide in advance how long you will hold a trade that does not move.
Use cases
- Trading pullbacks to a rising moving average during an established trend.
- Trading around earnings season, with position size reduced to account for gap risk.
- Following sector rotation, buying the strongest sector's leaders over several weeks.
Key takeaways
- Write the setup, entry, stop and target before entering.
- Position size from the stop distance, not from a hunch.
- Expectancy, not the win rate alone, decides whether a method is worth using.
- Review each trade in a journal to find what really works.
Key terms, explained
- Swing trading
- Holding trades for days to weeks to capture a price swing.
- Risk-reward ratio
- The potential profit of a trade compared with its potential loss. A 1:2 ratio means ₹2 of reward for each ₹1 risked.
- Position sizing
- Deciding how many shares to buy based on the maximum loss you accept and the distance to your stop.
- Stop-loss order
- An order that becomes a market or limit order when price reaches a set level, to limit a loss. It is not guaranteed to fill at that level.
- Breakout
- Price moving clearly above resistance or below support, often on higher volume.
- Drawdown
- The fall from a peak to a later low in your account or in a price, shown as a percentage.
Questions learners ask
How long should I hold a swing trade?
Typically a few days to a few weeks, based on the setup. Decide the maximum holding period before you enter, and exit if the trade does not move within that time.
What if the price gaps against my stop overnight?
The exit can happen well below your stop, so the loss can be larger than planned. Reduce position size on trades you hold overnight, and accept that gap risk exists.
How much capital do I need to start?
Enough that a 1% risk per trade gives a position you can handle. Very small capital makes it hard to manage costs and stop distances sensibly.
Educational content only, not investment advice. Markets carry risk, including loss of capital. Examples are simplified and may exclude charges, taxes and slippage.