

Fundamental Analysis
Evaluate a business using its financial statements, key ratios and quality checks.
1. What fundamental analysis is
Fundamental analysis asks whether a business is worth its price. It looks at the company's sales, profits, debts, cash, management and industry. The goal is to estimate what the business is worth and compare that with the share price. The gap between the two is the margin of safety that value investors look for.
2. Where to find the information
- Annual report: the full picture, including management discussion, risks and audited financial statements.
- Quarterly results: the latest profit, sales and sometimes cash flow. Filed on the exchange websites (NSE and BSE).
- Investor presentations and earnings calls: management's explanation of the numbers.
- Shareholding pattern: promoter, institutional and public holdings, filed every quarter.
- Corporate announcements: dividends, bonus issues, board decisions and material events.
3. The three financial statements
A company's story is told in three statements that must be read together.
- Profit and loss statement: revenue, expenses and profit over a period. Shows whether the business earns money.
- Balance sheet: assets, liabilities and equity at one date. Shows what the company owns and owes.
- Cash flow statement: cash from operations, investing and financing. Shows whether profits become real cash.
A company can show a profit and still run out of cash. Always check whether operating cash flow is close to net profit over several years.
4. Core ratios with formulas and an example
- EPS (earnings per share) = net profit ÷ number of shares. Example: ₹300 crore profit ÷ 10 crore shares = ₹30 EPS.
- P/E ratio = share price ÷ EPS. Example: ₹450 ÷ ₹30 = 15 times earnings.
- ROE (return on equity) = net profit ÷ shareholders' equity. Example: ₹500 crore ÷ ₹2,500 crore = 20%.
- Debt-to-equity = total debt ÷ shareholders' equity. Example: ₹1,000 crore ÷ ₹2,500 crore = 0.4.
- Dividend yield = dividend per share ÷ share price. Example: ₹10 ÷ ₹450 ≈ 2.2%.
- Operating margin = operating profit ÷ revenue. Shows how much each rupee of sales keeps after running costs.
5. Growth: is the company getting bigger and better?
A good business grows its sales and profits over time, and does so without needing ever more debt. Look at 5 to 10 years of data, not one quarter. Check whether revenue growth comes with stable or improving margins, and whether the return on capital stays high as the company expands.
6. Quality: the business behind the numbers
Ratios cannot tell you everything. Quality questions include: Does the company have a durable advantage, such as a brand, cost position, network or regulatory licence? Is management honest and competent, with a record of allocating capital well? Are related-party transactions or accounting changes a concern? Is the business easy to understand?
7. Valuation: how much is it worth?
Valuation estimates what the business is worth per share, using methods such as comparing P/E with peers, comparing price-to-book, or estimating future cash flows discounted to today. No method gives a single correct answer. Use two or three approaches to get a range, and buy only when the price is comfortably below your estimate.
- Relative valuation: compare P/E, price-to-book and EV/EBITDA with similar companies.
- Absolute valuation (discounted cash flow): estimate future cash flows and discount them. Very sensitive to assumptions.
- A cheap-looking stock can be a value trap if earnings are falling. A high-priced stock can still be good if growth is strong and durable.
8. A worked example
Company X: price ₹450, EPS ₹30 (P/E 15), ROE 20%, debt-to-equity 0.4, sales growing 15% a year for five years, operating margin steady at 18%. Peers trade at an average P/E of 20. Company X looks reasonable on these figures: strong returns, low debt and a P/E below peers. Before deciding, check the annual report for one-off profits, the quality of cash flow and the risks listed by management. The example is illustrative, not a recommendation.
9. Red flags to check every time
- Profits rising while operating cash flow falls for several years.
- Receivables growing much faster than sales.
- Frequent changes in auditors or accounting policies.
- Promoter shares being pledged in large amounts.
- Heavy reliance on one customer, one product or one government contract.
- Management that changes its targets or explanations often.
10. Building your own process
Write a one-page checklist: business model, growth, margins, returns, debt, cash flow, management, valuation, and risks. Fill it in from the annual report before you read any opinion. Review your holdings when results come out, not every day. Your job is to understand the business well enough to explain why you own it, and to know what would make you sell.
Charts and visuals
Worked examples
P/E and earnings growth
A stock trades at ₹300 with EPS of ₹15, so P/E = 20. If EPS rises 20% to ₹18 and the price stays at ₹300, P/E falls to 16.7. Higher earnings can make a stock look cheaper even at the same price.
Return on equity
Net profit ₹500 crore on shareholders' equity of ₹2,500 crore gives ROE = 500 ÷ 2,500 = 20%. Debt of ₹1,000 crore against that equity gives debt-to-equity = 1,000 ÷ 2,500 = 0.4.
Real-life scenarios
Profit rises but cash flow is negative
The company reports higher profit, but operating cash flow is negative and receivables grow faster than sales. This can mean customers are not paying. Profit that never turns into cash is a warning sign.
Cheap stock in a shrinking industry
A stock has a P/E of 6, far below its peers. Its industry is losing demand and earnings are falling each year. A low P/E here may be a value trap, not a bargain.
Use cases
- Screening for companies with consistent ROE above a chosen level over five years.
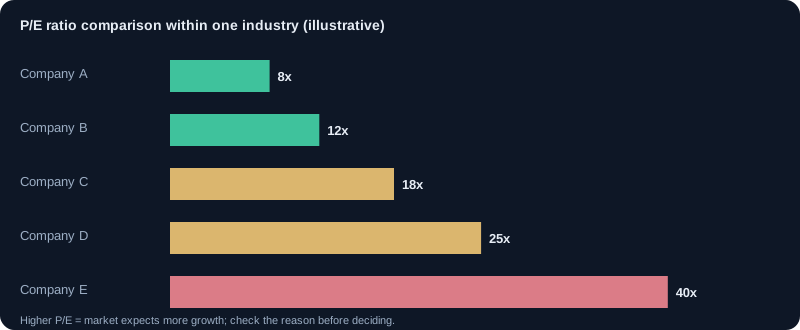
- Comparing two companies in the same industry using P/E, margins and debt levels.
- Reading the annual report before results to understand management's plans and risks.
Key takeaways
- Read the three statements together; one statement alone can mislead.
- P/E only makes sense relative to growth, risk and industry peers.
- Check whether profit converts to cash flow.
- Ratios start the research; business quality and management decide the conclusion.
Key terms, explained
- EPS (earnings per share)
- Net profit divided by the number of shares outstanding.
- P/E ratio
- Share price divided by earnings per share. It shows how much investors pay for each rupee of earnings.
- Book value
- Shareholders' equity divided by the number of shares: the accounting value per share.
- ROE (return on equity)
- Net profit divided by shareholders' equity. It shows how well the company uses shareholder money.
- Debt-to-equity
- Total debt divided by shareholders' equity. Higher values mean more borrowing.
- Dividend yield
- Annual dividend per share divided by share price, shown as a percentage.
- Revenue (sales)
- Total income from selling goods or services before any costs are deducted.
- Net profit
- What is left from revenue after all costs, interest and taxes are paid.
- Balance sheet
- A statement of assets, liabilities and equity at one point in time.
- Cash flow statement
- A record of the actual cash coming in and going out, from operations, investing and financing.
- Annual report
- A yearly document from a company with financial statements, management discussion and risks.
- Market capitalisation (market cap)
- Share price multiplied by the number of shares outstanding. Companies are grouped as large, mid or small cap.
Questions learners ask
Is a high P/E ratio always bad?
No. A high P/E can reflect strong expected growth. Compare the P/E with companies in the same industry and with the company's own history, and check whether the growth is real.
Where do I find a company's financial statements?
In the company's annual report and quarterly results, which are filed with the exchanges. They are public on the NSE and BSE websites.
How often should I review a company I own?
Review it when new results or annual reports come out, and when something changes in the business. Daily price moves are not a reason to re-analyse the business.
Educational content only, not investment advice. Markets carry risk, including loss of capital. Examples are simplified and may exclude charges, taxes and slippage.