

How to Read Quarterly Results
How to read the numbers in a quarterly results filing, compare them correctly, and spot one-off items.
1. What a quarterly filing contains
Listed companies file quarterly results with the exchanges, normally within a set deadline after each quarter (check the current SEBI rules). A filing has the income statement for the quarter, comparisons with earlier periods, and often segment and cash details. The first page is a summary; the detail is in the tables.
2. The key lines, top to bottom
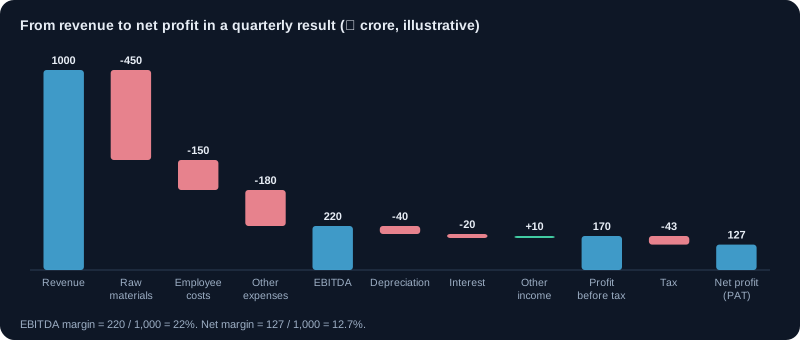
- Revenue (sales): total income from core operations.
- Operating expenses and EBITDA: earnings before interest, tax, depreciation and amortisation. A measure of operating performance.
- Depreciation, interest and other income: the non-operating items.
- Profit before tax (PBT), tax, and profit after tax (PAT): the bottom line.
- EPS: profit per share, the figure most used in valuation.
3. Compare the right periods
Year-on-year (YoY) compares the same quarter of last year and removes seasonality. Quarter-on-quarter (QoQ) compares with the previous quarter and shows momentum, but can mislead for seasonal businesses such as festive-season retail. Use YoY for the trend and QoQ for recent direction.
4. Margins: the quality of growth
Revenue growth is not enough. Check EBITDA margin (EBITDA ÷ revenue) and net margin (PAT ÷ revenue). If sales grow but margins shrink, growth is being bought at a cost. Stable or rising margins with growing sales are the best sign.
Example: revenue up 20% YoY, EBITDA margin from 18% to 16%. Sales grew, but the business earned less per rupee of sales.
5. One-off and exceptional items
Profit can jump because of a one-time gain, such as selling a property or a tax refund. Exceptional items are shown separately. Remove them to see the normal earning power. A quarter that looks strong only because of exceptional income is weaker than the headline suggests.
6. Other income matters
Other income can be interest on cash or gains on investments. For a company whose profit depends mainly on other income, the core business is weak. Check how much of PBT comes from operations.
7. Read the commentary and guidance
The results press release and the earnings call explain the numbers. Management may give guidance on sales, margins or capex. Compare what they promised last quarter with what happened. Missed guidance repeated over quarters is a warning.
8. A reading checklist
- Revenue growth YoY and QoQ.
- EBITDA and net margin trend.
- Exceptional items and other income share of profit.
- EPS growth and tax rate change.
- Operating cash flow in the next annual report, to confirm profit turns into cash.
- Management's guidance compared with actual results.
9. Deadlines, audit status and where to find results
Under SEBI's listing rules, companies must file quarterly results within 45 days of the end of the quarter, and audited results for the full year within 60 days of the year end. The board meeting date is announced in advance on the exchange.
- Find results on the NSE or BSE company page under financial results and announcements, or on the company's investor relations page.
- Quarterly numbers are usually 'limited reviewed' by the auditor, a lighter check than a full audit. Year-end numbers are audited.
- Read the notes printed below the results table: they explain one-off items, changes in accounting and pending legal matters.
- Insiders cannot trade during the 'trading window closure' before results, a rule against insider trading.
10. Standalone, consolidated and segment results
Companies publish standalone results (the listed company alone) and consolidated results (including subsidiaries). For a group, consolidated is the true picture. Many also report segments, such as by product line or region, which show where growth and profit actually come from.
Example: a company's consolidated revenue grows 12%, but its segment table shows the main business grew 3% while a new, loss-making segment grew 80%. The headline growth is real, but its quality is weaker than it looks.
11. Seasonality: why QoQ can mislead
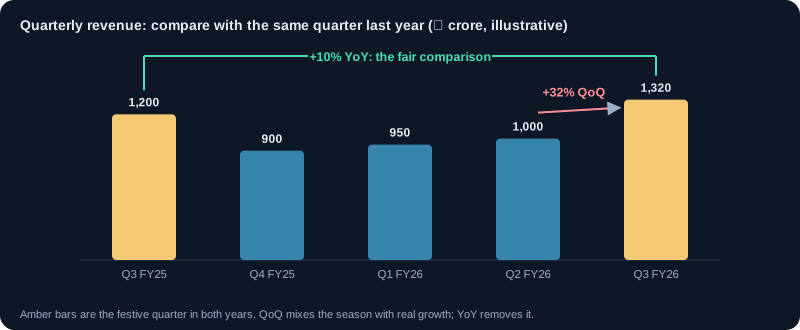
Many businesses have strong and weak quarters (festive demand, monsoon, year-end orders). Comparing a quarter with the one just before it (QoQ) mixes up seasonal swings with real change. Year-on-year (YoY) comparison removes most seasonality.
| Quarter | Revenue (₹ crore) | QoQ change | YoY change |
|---|---|---|---|
| Q3 FY25 (Oct–Dec) | 1,200 | ||
| Q4 FY25 (Jan–Mar) | 900 | −25% | |
| Q1 FY26 (Apr–Jun) | 950 | +6% | |
| Q2 FY26 (Jul–Sep) | 1,000 | +5% | |
| Q3 FY26 (Oct–Dec) | 1,320 | +32% | +10% |
A headline of '+32% QoQ' sounds excellent, but the festive quarter is always the strongest. The fair comparison is with the same quarter last year: +10%.
12. A worked result: reported versus underlying profit
Example Ltd, Q2 FY26 against Q2 FY25, ₹ crore.
| Line | Q2 FY26 | Q2 FY25 | Change |
|---|---|---|---|
| Revenue | 1,000 | 900 | +11% |
| EBITDA | 180 | 171 | +5% |
| EBITDA margin | 18.0% | 19.0% | −1.0 point |
| Other income | 40 | 10 | +300% |
| Exceptional gain (sale of land) | 60 | 0 | |
| Reported net profit | 190 | 110 | +73% |
| Net profit excluding the one-off gain (after tax) | 145 | 110 | +32% |
The headline says profit jumped 73%. Remove the one-time land sale and profit grew 32%; most of that came from other income (treasury gains), not from the business. Operating profit (EBITDA) grew only 5%, and margins shrank. The core business slowed even though the headline looks strong.
13. Results day: expectations and the price reaction
- Prices move on results versus expectations, not on results alone. Good numbers that miss analysts' estimates can send a stock down.
- Management guidance and the earnings call often move the price more than the past quarter's numbers.
- The first minutes after results are volatile, with wide spreads and gaps. Beginners should avoid trading the announcement itself.
- Read the investor presentation and listen to (or read the transcript of) the earnings call for the reasons behind the numbers.
- Option premiums are often high before results and fall sharply afterwards, even if the stock moves.
Charts and visuals
Worked examples
EPS from a result
Net profit for the quarter is ₹145 crore and the company has 25 crore shares, so quarterly EPS is ₹5.80. Adding the last four quarters' EPS (for example ₹5.20 + ₹5.50 + ₹5.40 + ₹5.80 = ₹21.90) gives trailing twelve-month EPS, which is used for the P/E ratio.
Margin change in rupees
Revenue ₹1,000 crore at an 18% EBITDA margin gives ₹180 crore. At last year's 19%, it would have been ₹190 crore. A one-point margin drop cost ₹10 crore of operating profit in a single quarter.
Real-life scenarios
Profit beats, stock falls
A company reports 20% profit growth, beating last year comfortably, but the stock falls 6%. Analysts expected 25%, and management cut its full-year revenue guidance on the call. The market priced in the future, not the past quarter.
A one-off hides a slowdown
Net profit doubles because of a tax refund. Revenue grew 4% and margins fell. Investors who read only the headline bought; those who read the notes saw the refund and the weak core numbers.
Use cases
- Tracking revenue, EBITDA margin and profit for the last eight quarters in a simple sheet.
- Comparing reported profit with profit excluding exceptional items and unusual other income.
- Checking segment results to see which business is driving growth.
- Comparing management's guidance with the results that follow, to judge how reliable it is.
Key takeaways
- Compare a quarter with the same quarter last year to remove seasonality.
- Start from revenue and EBITDA margin; the bottom line can be moved by one-offs and other income.
- Read consolidated results for groups, and the segment table for where growth comes from.
- Results move prices against expectations and guidance, not in isolation.
- Quarterly numbers are limited-reviewed, not audited; the notes explain the unusual items.
Key terms, explained
- EBITDA
- Earnings before interest, tax, depreciation and amortisation. A measure of operating performance.
- Net profit
- What is left from revenue after all costs, interest and taxes are paid.
- Revenue (sales)
- Total income from selling goods or services before any costs are deducted.
- EPS (earnings per share)
- Net profit divided by the number of shares outstanding.
- Exceptional items
- Large, unusual or one-time gains or losses shown separately in results, such as a property sale or a write-down.
- Operating margin
- Operating profit divided by revenue. How much of each rupee of sales is left after running costs.
Questions learners ask
When do companies announce quarterly results?
Within 45 days of the quarter's end (60 days for the audited full-year results under SEBI rules). Most announce the board meeting date a week or more in advance; the exchange announcements page lists it.
Should I buy just before results?
It is a gamble on an unknown outcome and on how the market will react. Many experienced investors wait for the results and the earnings call, then decide with the information in hand.
What is EBITDA and why do analysts use it?
Earnings before interest, tax, depreciation and amortisation: operating profit before financing and accounting charges for assets. It helps compare operating performance, but it ignores the real cost of capex and debt, so never use it alone.
Why are the standalone and consolidated numbers so different?
Consolidated results include subsidiaries, joint ventures and associates. If subsidiaries are large or loss-making, the two can differ a lot. For investors in the listed company, the consolidated numbers usually matter more.
Educational content only, not investment advice. Markets carry risk, including loss of capital. Examples are simplified and may exclude charges, taxes and slippage.