

Reading Charts
Understand line, bar and candlestick charts, OHLC data, and volume.
1. What a chart is
A price chart is a picture of how the price of an asset changed over time. Each point or bar in the chart summarises a period: a minute, a day, a week. Charts do not show the future; they help you see what has already happened, which can guide decisions about trend, risk and timing.
2. Chart types
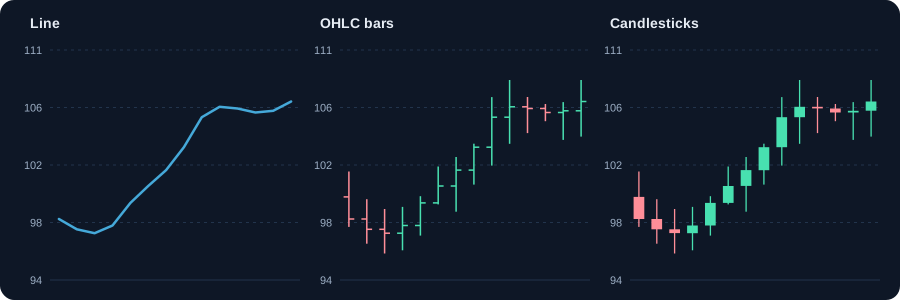
- Line chart: joins the closing prices. The simplest view; good for seeing the overall trend.
- Bar (OHLC) chart: each bar shows the open, high, low and close. The left tick is the open, the right tick is the close, the bar is the high to low range.
- Candlestick chart: the same four values, drawn as a body (open to close) and wicks (high and low). Easiest to read at a glance.
- Area chart: a line with the area below filled. Common in apps and websites; similar to a line chart.
3. Reading one candle
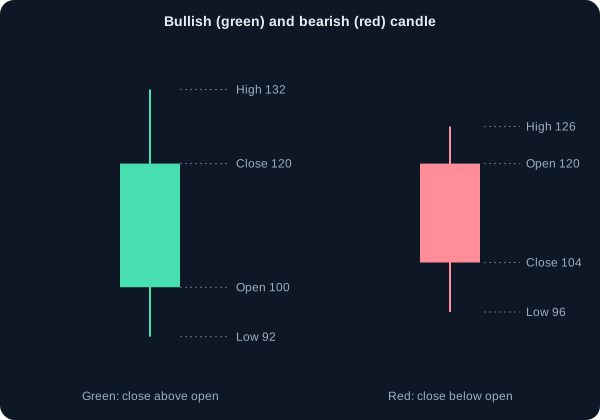
Each candle has a body and up to two wicks. The body shows the distance between the open and the close. The wicks show how far the price went beyond the body during the period.
- Green (or white) candle: close above open. Buyers were in control at the end of the period.
- Red (or black) candle: close below open. Sellers were in control at the end of the period.
- Long body: strong move in one direction during the period.
- Long wick: price tried to go one way and was pushed back. Long upper wicks mean sellers stepped in at higher prices.
Example: open ₹100, high ₹108, low ₹97, close ₹105. The candle is green. The body runs from ₹100 to ₹105 (₹5). The upper wick is ₹3 (₹105 to ₹108). The lower wick is ₹3 (₹97 to ₹100).
4. Timeframes: choosing how far to zoom
The same stock looks very different on a 5-minute chart and a weekly chart. Each timeframe tells a different story. Use a higher timeframe to decide the direction and a lower timeframe to time an entry.
- Intraday (1 to 15 minutes): noise and fast swings. Used by intraday traders.
- Daily: one candle per session. The most common view for swing traders and beginners.
- Weekly and monthly: the bigger trend. Used by investors to see the long-term direction.
5. Volume: the strength behind a move
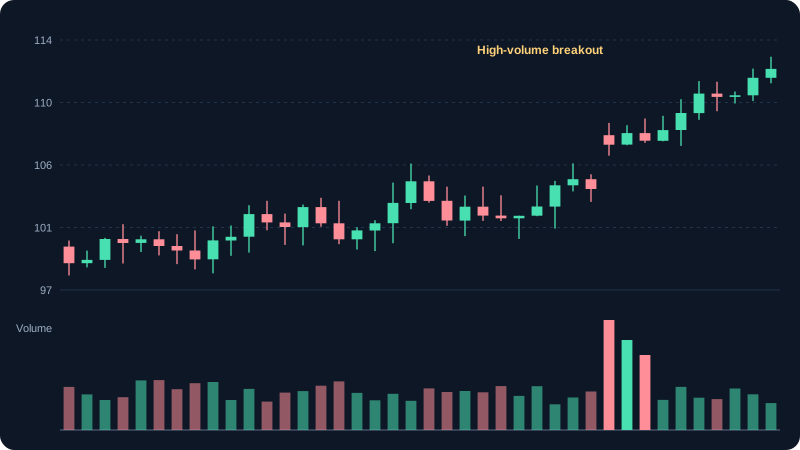
Volume is the number of shares traded in the period. It tells you how much participation supports a price move. A breakout on high volume usually has more support than the same move on low volume.
Example: a stock breaks above ₹250 on 2.5 times its 20-day average volume. That is stronger evidence than a break on average volume. Volume does not guarantee the move will continue; it gives it weight.
6. Support and resistance on the chart
Support is a price level where buying has tended to appear, and resistance is where selling has tended to appear. On a chart you see them as horizontal zones where price has bounced several times. A break through a level with volume can flip it: resistance can become support.
7. Trend: the direction to trade with
An uptrend makes higher highs and higher lows. A downtrend makes lower highs and lower lows. A sideways market makes no clear progress. Many beginners lose money by trading against a clear trend. Identify the trend first, then look for entries in its direction.
- Draw trend lines through the lows in an uptrend or the highs in a downtrend.
- A trend is weakening when a higher low fails to form, or when price closes below its previous low.
- A sideways market (range) suits range-trading tools; a trend suits trend-following tools.
8. Chart settings that matter
- Use a logarithmic scale for long periods. It shows percentage moves more fairly.
- Adjust for splits and bonus issues. Otherwise an old price looks falsely high or low.
- Compare with an index chart to see whether a move is stock-specific or market-wide.
9. Common chart-reading mistakes
- Reading too much into one candle. Look at the sequence and the context.
- Using only one timeframe. Check the higher one as well.
- Drawing levels after the fact, which makes every price look predictable.
- Ignoring volume and the broad market.
- Believing a chart shows certainty. It shows what happened, with probabilities for what may follow.
10. Putting it together
A simple routine: check the higher timeframe for the trend, mark the main support and resistance, look at volume during the last move, then read the latest candles for signals. Only after this should you consider an entry, with a stop-loss and a position size.
Charts and visuals
Worked examples
Reading one candle
Open ₹100, high ₹108, low ₹97, close ₹105. The close is above the open, so the candle is green. The body runs from ₹100 to ₹105. The upper wick is ₹105 to ₹108 (₹3), and the lower wick is ₹97 to ₹100 (₹3).
Daily percentage change
Yesterday's close was ₹200 and today's close is ₹206. Change = (206 − 200) ÷ 200 = +3%. Charts show the move, but the percentage tells you its size.
Real-life scenarios
Price rises on falling volume
The stock climbs for three days while volume drops each day. Rising prices without volume support are weaker and more likely to reverse. Wait for confirmation before acting.
Daily chart down, weekly chart up
The weekly trend is up, but the daily chart shows a short decline. This is often a pause or pullback inside a larger uptrend. Looking at more than one timeframe gives better context.
Use cases
- Checking the trend on a weekly chart before entering a trade on a daily chart.
- Comparing two stocks in the same sector to see which is holding up better.
- Spotting unusual volume around results or news, which can show where big players are active.
Key takeaways
- A candle shows open, high, low and close for its period.
- Colour shows direction; the body shows the range between open and close; wicks show extremes.
- Volume gives weight to price moves.
- Use more than one timeframe to avoid being misled by one chart.
Key terms, explained
- Candlestick
- A chart element showing open, high, low and close for a period, coloured by direction.
- Volume
- The number of shares traded in a period. High volume means more participation.
- Trend
- The general direction of price: up (higher highs and lows), down (lower highs and lows), or sideways.
- Support
- A price level where buying has tended to appear and stop further falls.
- Resistance
- A price level where selling has tended to appear and stop further rises.
Questions learners ask
Which timeframe should a beginner use?
Daily charts are a good start because each candle covers a full session and shows the trend clearly. Weekly charts help you see the bigger trend. Avoid very short timeframes until you understand the basics.
Why are some candles green and some red?
Green (or white) means the close was above the open. Red (or black) means the close was below the open. The colour only shows direction within that period.
Are line charts useless?
No. A line chart is the simplest view of the closing prices and is good for seeing the overall trend. Candlesticks add the open, high and low, which show more detail.
Educational content only, not investment advice. Markets carry risk, including loss of capital. Examples are simplified and may exclude charges, taxes and slippage.